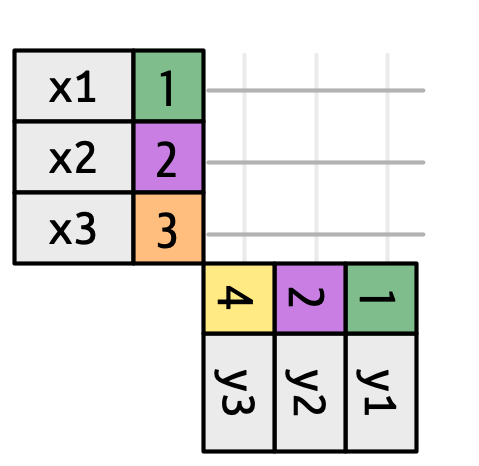
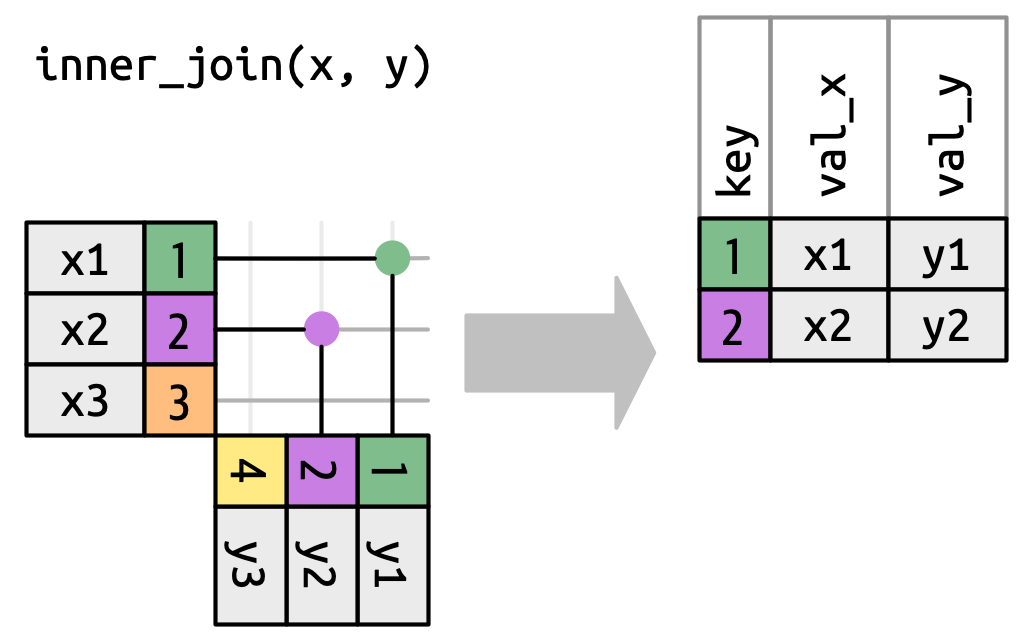
class: center, middle, inverse, title-slide .title[ # Data Wrangling 2 ] .subtitle[ ## Grouping, joining, filtering, piping ] .author[ ### Guillaume Falmagne ] .date[ ### <br> Oct. 2nd, 2024 ] --- # Cheat sheets galore .pull-left[ .font150[ [Posit/Rstudio Cheatsheets](https://rstudio.github.io/cheatsheets/) [Pandas data wrangling cheatsheet](https://github.com/pandas-dev/pandas/blob/main/doc/cheatsheet/Pandas_Cheat_Sheet.pdf)] ] .pull-right[ .font150[ ] ] --- class: inverse, center, middle # Processing data sets --- # Counting along a column - Example processing: `count` the number of rows in a column that share the same value - Also gives you the unique values in a column (as does the base function `unique`) .pull-left[ ``` r #pak::pkg_install("nycflights13") library(nycflights13) library(tidyverse) flights %>% count(carrier) ``` ``` ## # A tibble: 16 × 2 ## carrier n ## <chr> <int> ## 1 9E 18460 ## 2 AA 32729 ## 3 AS 714 ## 4 B6 54635 ## 5 DL 48110 ## 6 EV 54173 ## 7 F9 685 ## 8 FL 3260 ## 9 HA 342 ## 10 MQ 26397 ## 11 OO 32 ## 12 UA 58665 ## 13 US 20536 ## 14 VX 5162 ## 15 WN 12275 ## 16 YV 601 ``` ] .pull-right[ - pandas equivalent: `flights.value_counts(carrier)` ] --- # Grouping using `group_by` - We can also separate our processing using some grouping variable - All sensible operations happen inside groups in a grouped data.frame .pull-left[ ``` r flights %>% group_by(carrier) %>% count(origin) ``` ``` ## # A tibble: 35 × 3 ## # Groups: carrier [16] ## carrier origin n ## <chr> <chr> <int> ## 1 9E EWR 1268 ## 2 9E JFK 14651 ## 3 9E LGA 2541 ## 4 AA EWR 3487 ## 5 AA JFK 13783 ## 6 AA LGA 15459 ## 7 AS EWR 714 ## 8 B6 EWR 6557 ## 9 B6 JFK 42076 ## 10 B6 LGA 6002 ## # ℹ 25 more rows ``` ] .pull-right[ - Also exists in pandas (very flexible!): `flights.groupby('carrier')` ] --- # Summarizing values using `summarize` .pull-left[ - `summarize` can be used to perform operations in the columns ``` r flights %>% summarise(mean_delay = mean(arr_delay, na.rm = TRUE)) ``` ``` ## # A tibble: 1 × 1 ## mean_delay ## <dbl> ## 1 6.90 ``` ] --- # Summarizing values using `summarize` .pull-left[ - `summarize` can be used to perform operations in the columns ``` r flights %>% summarise(mean_delay = mean(arr_delay, na.rm = TRUE)) ``` ``` ## # A tibble: 1 × 1 ## mean_delay ## <dbl> ## 1 6.90 ``` ] .pull-right[ - With `group_by`, this is a powerful function: ``` r flights %>% group_by(carrier) %>% summarize(delay = mean(arr_delay, na.rm = TRUE)) %>% print(n = 9) ``` ``` ## # A tibble: 16 × 2 ## carrier delay ## <chr> <dbl> ## 1 9E 7.38 ## 2 AA 0.364 ## 3 AS -9.93 ## 4 B6 9.46 ## 5 DL 1.64 ## 6 EV 15.8 ## 7 F9 21.9 ## 8 FL 20.1 ## 9 HA -6.92 ## # ℹ 7 more rows ``` ] --- # Summarizing values using `summarize` .pull-left[ - `summarize` can be used to perform operations in the columns ``` r flights %>% summarise(mean_delay = mean(arr_delay, na.rm = TRUE)) ``` ``` ## # A tibble: 1 × 1 ## mean_delay ## <dbl> ## 1 6.90 ``` - Even easier in pandas: `flights.groupby('carrier').mean()` (NaNs are automatically ignored) ] .pull-right[ - With `group_by`, this is a powerful function: ``` r flights %>% group_by(carrier) %>% summarize(delay = mean(arr_delay, na.rm = TRUE)) %>% print(n = 9) ``` ``` ## # A tibble: 16 × 2 ## carrier delay ## <chr> <dbl> ## 1 9E 7.38 ## 2 AA 0.364 ## 3 AS -9.93 ## 4 B6 9.46 ## 5 DL 1.64 ## 6 EV 15.8 ## 7 F9 21.9 ## 8 FL 20.1 ## 9 HA -6.92 ## # ℹ 7 more rows ``` ] --- # Summarize across multiple columns - the `across` function can apply a summary function across multiple variables: ``` r iris |> summarize(across(1:4, mean)) ``` ``` ## Sepal.Length Sepal.Width Petal.Length Petal.Width ## 1 5.843333 3.057333 3.758 1.199333 ``` - In python: `iris.iloc[:, 0:4].mean()` --- # Adding columns using conditionals - `if_else` function plays nice with tidyverse ``` r library(covidcast) data(state_census) head(state_census[1:6]) ``` ``` ## SUMLEV REGION DIVISION STATE NAME POPESTIMATE2019 ## 1 10 0 0 0 United States 328239523 ## 2 40 3 6 1 Alabama 4903185 ## 3 40 4 9 2 Alaska 731545 ## 4 40 4 8 4 Arizona 7278717 ## 5 40 3 7 5 Arkansas 3017804 ## 6 40 4 9 6 California 39512223 ``` ``` r state_census %>% mutate(Size = if_else(POPESTIMATE2019 > mean(POPESTIMATE2019), "Large", "Small")) %>% select(NAME, Size) ``` ``` ## NAME Size ## 1 United States Large ## 2 Alabama Small ## 3 Alaska Small ## 4 Arizona Small ## 5 Arkansas Small ## 6 California Large ## 7 Colorado Small ## 8 Connecticut Small ## 9 Delaware Small ## 10 District of Columbia Small ## 11 Florida Large ## 12 Georgia Small ## 13 Hawaii Small ## 14 Idaho Small ## 15 Illinois Large ## 16 Indiana Small ## 17 Iowa Small ## 18 Kansas Small ## 19 Kentucky Small ## 20 Louisiana Small ## 21 Maine Small ## 22 Maryland Small ## 23 Massachusetts Small ## 24 Michigan Small ## 25 Minnesota Small ## 26 Mississippi Small ## 27 Missouri Small ## 28 Montana Small ## 29 Nebraska Small ## 30 Nevada Small ## 31 New Hampshire Small ## 32 New Jersey Small ## 33 New Mexico Small ## 34 New York Large ## 35 North Carolina Small ## 36 North Dakota Small ## 37 Ohio Large ## 38 Oklahoma Small ## 39 Oregon Small ## 40 Pennsylvania Large ## 41 Rhode Island Small ## 42 South Carolina Small ## 43 South Dakota Small ## 44 Tennessee Small ## 45 Texas Large ## 46 Utah Small ## 47 Vermont Small ## 48 Virginia Small ## 49 Washington Small ## 50 West Virginia Small ## 51 Wisconsin Small ## 52 Wyoming Small ## 53 Puerto Rico Commonwealth Small ## 54 American Samoa Small ## 55 Guam Small ## 56 U.S. Virgin Islands Small ## 57 Northern Mariana Islands Small ``` --- # Multiple case conditions .pull-left[ - `case_when()` is a multi-case `if_else()` ``` r starwars |> mutate(type = case_when( height > 200 | mass > 200 ~ "large", species == "Droid" ~ "robot", TRUE ~ "other" )) %>% select(name, type) %>% print(n = 7) ``` ``` ## # A tibble: 87 × 2 ## name type ## <chr> <chr> ## 1 Luke Skywalker other ## 2 C-3PO robot ## 3 R2-D2 robot ## 4 Darth Vader large ## 5 Leia Organa other ## 6 Owen Lars other ## 7 Beru Whitesun Lars other ## # ℹ 80 more rows ``` ] .pull-right[ - In pandas: ``` python starwars['type'] = 'other' starwars['type'].case_when([ (starwars['height'] > 200 | starwars['mass'] > 200, "large") (starwars['species'] == 'Droid', "robot") ]) ``` ] --- # Combining operations is key! - The power of the `tidyverse` tools comes from combining the operations: - Finding fast flights to Houston: .pull-left[ ``` r flights |> filter(dest == "IAH") |> mutate(speed = distance / air_time * 60) |> select(year:day, dep_time, carrier, flight, speed) |> arrange(desc(speed)) |> print(n = 3) ``` ``` ## # A tibble: 7,198 × 7 ## year month day dep_time carrier flight speed ## <int> <int> <int> <int> <chr> <int> <dbl> ## 1 2013 7 9 707 UA 226 522. ## 2 2013 8 27 1850 UA 1128 521. ## 3 2013 8 28 902 UA 1711 519. ## # ℹ 7,195 more rows ``` ] .pull-right[ - In pandas: ``` python flights[flights['dest'] == 'IAH'].fcn1().fcn2() ``` ] --- # No pipes? - Nested calls ``` r arrange( select( mutate( filter( flights, dest == "IAH" ), speed = distance / air_time * 60 ), year:day, dep_time, carrier, flight, speed ), desc(speed) ) ``` -- - Intermediate objects ``` r flights1 <- filter(flights, dest == "IAH") flights2 <- mutate(flights1, speed = distance / air_time * 60) flights3 <- select(flights2, year:day, dep_time, carrier, flight, speed) arrange(flights3, desc(speed)) ``` --- class: left, top background-image: url(figures/famousforcleaning.jpg) background-position: center middle background-size: 70% # Everyone still there? --- class: inverse, center, middle # Merging multiple datasets --- # Combining data sets by rows - Sometimes the information we want is split across two data.frames - If the columns are all the same, we can just glue them together: .pull-left[ ``` r (df_1 = data.frame(x = 1:3, y = rnorm(3))) ``` ``` ## x y ## 1 1 0.2291029 ## 2 2 0.8480977 ## 3 3 0.5380033 ``` ``` r (df_2 = data.frame(x = 4:6, y = rnorm(3))) ``` ``` ## x y ## 1 4 -0.20230868 ## 2 5 -0.05133095 ## 3 6 0.19981989 ``` ] -- .pull-right[ ``` r bind_rows(df_1, df_2) ``` ``` ## x y ## 1 1 0.22910295 ## 2 2 0.84809769 ## 3 3 0.53800334 ## 4 4 -0.20230868 ## 5 5 -0.05133095 ## 6 6 0.19981989 ``` - For many data.frames, we can put them in a list: ```r dfs = list(df_1, df_2, df_1) bind_rows(dfs) ``` - pandas equivalent: `pd.concat([df1, df2])` ] --- # Two dataframes with the same keys .pull-left[ ``` r n_flights = flights %>% count(carrier) n_flights ``` ``` ## # A tibble: 16 × 2 ## carrier n ## <chr> <int> ## 1 9E 18460 ## 2 AA 32729 ## 3 AS 714 ## 4 B6 54635 ## 5 DL 48110 ## 6 EV 54173 ## 7 F9 685 ## 8 FL 3260 ## 9 HA 342 ## 10 MQ 26397 ## 11 OO 32 ## 12 UA 58665 ## 13 US 20536 ## 14 VX 5162 ## 15 WN 12275 ## 16 YV 601 ``` ] .pull-right[ ``` r airlines ``` ``` ## # A tibble: 16 × 2 ## carrier name ## <chr> <chr> ## 1 9E Endeavor Air Inc. ## 2 AA American Airlines Inc. ## 3 AS Alaska Airlines Inc. ## 4 B6 JetBlue Airways ## 5 DL Delta Air Lines Inc. ## 6 EV ExpressJet Airlines Inc. ## 7 F9 Frontier Airlines Inc. ## 8 FL AirTran Airways Corporation ## 9 HA Hawaiian Airlines Inc. ## 10 MQ Envoy Air ## 11 OO SkyWest Airlines Inc. ## 12 UA United Air Lines Inc. ## 13 US US Airways Inc. ## 14 VX Virgin America ## 15 WN Southwest Airlines Co. ## 16 YV Mesa Airlines Inc. ``` ] --- # Combine by columns: match .pull-left[ - `match` makes sure the keys coincide ``` r airline_rows = match(n_flights$carrier, airlines$carrier) n_flights$name = airlines$name[airline_rows] n_flights ``` ``` ## # A tibble: 16 × 3 ## carrier n name ## <chr> <int> <chr> ## 1 9E 18460 Endeavor Air Inc. ## 2 AA 32729 American Airlines Inc. ## 3 AS 714 Alaska Airlines Inc. ## 4 B6 54635 JetBlue Airways ## 5 DL 48110 Delta Air Lines Inc. ## 6 EV 54173 ExpressJet Airlines Inc. ## 7 F9 685 Frontier Airlines Inc. ## 8 FL 3260 AirTran Airways Corporation ## 9 HA 342 Hawaiian Airlines Inc. ## 10 MQ 26397 Envoy Air ## 11 OO 32 SkyWest Airlines Inc. ## 12 UA 58665 United Air Lines Inc. ## 13 US 20536 US Airways Inc. ## 14 VX 5162 Virgin America ## 15 WN 12275 Southwest Airlines Co. ## 16 YV 601 Mesa Airlines Inc. ``` ] .pull-right[ - This works well if all the keys in the first data.frame are in the second data.frames - in pandas: `n_flights.merge(airlines, on=['carrier'])` ] --- class: left, top background-image: url(figures/venn.png) background-position: center middle background-size: 90% # What if the keys don't match? Joins! Help on join in R: [https://r4ds.hadley.nz/joins.html](https://r4ds.hadley.nz/joins.html) --- # Example data set .center[  ] --- # Possible relations between keys .center[  ] --- # Inner join, only common keys are kept .center[  ] pandas: `pd.merge(df1, df2, how='inner', on='x')` --- class: left, top background-image: url(figures/Join_Forces_meme.png) background-position: center middle background-size: 70% # R and python can do the same things... --- # Left join, all keys of x are kept .center[  ] pandas: `pd.merge(df1, df2, how='left', on='x')` --- # Right join, all keys of y are kept .center[  ] pandas: `pd.merge(df1, df2, how='right', on='x')` --- # Full/outer join, all keys are kept .center[  ] pandas: `pd.merge(df1, df2, how='outer', on='x')` --- # Our example ``` r n_flights = flights %>% count(carrier) inner_join(n_flights, airlines, by = "carrier") %>% arrange(desc(n)) ``` ``` ## # A tibble: 16 × 3 ## carrier n name ## <chr> <int> <chr> ## 1 UA 58665 United Air Lines Inc. ## 2 B6 54635 JetBlue Airways ## 3 EV 54173 ExpressJet Airlines Inc. ## 4 DL 48110 Delta Air Lines Inc. ## 5 AA 32729 American Airlines Inc. ## 6 MQ 26397 Envoy Air ## 7 US 20536 US Airways Inc. ## 8 9E 18460 Endeavor Air Inc. ## 9 WN 12275 Southwest Airlines Co. ## 10 VX 5162 Virgin America ## 11 FL 3260 AirTran Airways Corporation ## 12 AS 714 Alaska Airlines Inc. ## 13 F9 685 Frontier Airlines Inc. ## 14 YV 601 Mesa Airlines Inc. ## 15 HA 342 Hawaiian Airlines Inc. ## 16 OO 32 SkyWest Airlines Inc. ``` --- # I can never remember any of this!! .center[ .font170[**Use the cheat sheet!**] ] https://rstudio.github.io/cheatsheets/html/data-transformation.html https://github.com/pandas-dev/pandas/blob/main/doc/cheatsheet/Pandas_Cheat_Sheet.pdf